
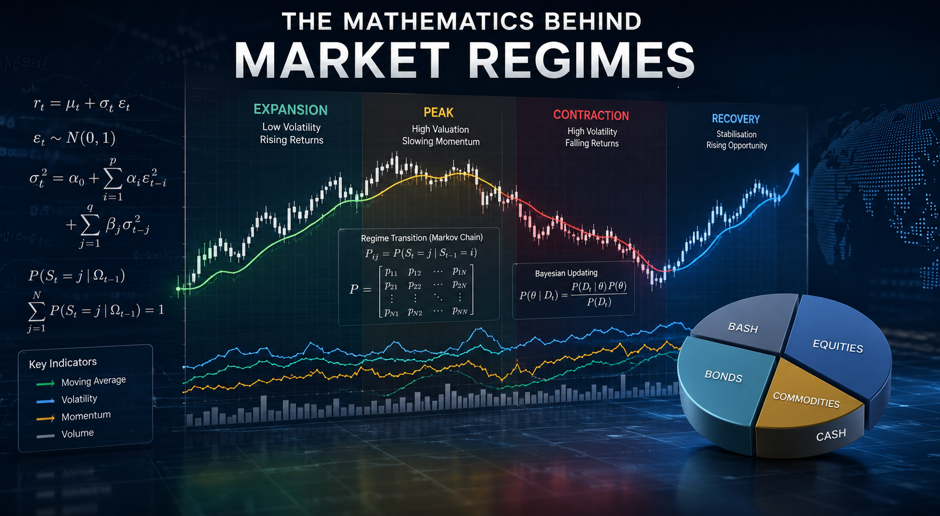
Understanding financial markets has never been more important for investors, businesses, and decision-makers operating in today's interconnected global economy. Markets rarely move in a straight line. Instead, they transition through different phases known as market regimes, where patterns of volatility, returns, liquidity, and investor behaviour shift over time. Whether analysing equities, commodities, currencies, or alternative assets, recognising these changing environments can help investors make more informed decisions and manage risk more effectively.
For businesses and investors across the UAE, including Dubai, Abu Dhabi, Sharjah, Ajman, Ras Al Khaimah, and Fujairah, understanding market regimes is particularly relevant. Regional markets are influenced by global economic trends, energy prices, monetary policy decisions, geopolitical developments, and technological innovation. As a result, financial professionals increasingly rely on quantitative methods and mathematical models to identify and adapt to changing market conditions.
The mathematics behind market regimes combines probability theory, statistics, stochastic processes, machine learning, and quantitative finance. Rather than relying solely on intuition or historical observations, mathematical frameworks provide objective tools to analyse market behaviour. These models help investors determine whether markets are experiencing expansion, contraction, high volatility, low volatility, bullish momentum, or bearish trends. By understanding the mathematical foundations behind these shifts, organisations can build more resilient investment strategies and improve long-term decision-making.
What Are Market Regimes?
A market regime refers to a distinct period during which financial markets exhibit relatively consistent characteristics. These characteristics can include volatility levels, return distributions, liquidity conditions, interest rate environments, and correlations between asset classes. While many investors focus on predicting individual price movements, professional quantitative analysts often prioritise identifying the current regime because market behaviour tends to vary significantly across different environments.
For example, a low-volatility bull market behaves very differently from a high-volatility bear market. Strategies that perform exceptionally well during one regime may struggle when conditions change. A momentum strategy might generate strong returns during trending markets but underperform during periods of uncertainty or sideways movement. Understanding which regime is currently dominant allows investors to adjust their portfolios accordingly.
Market regimes are not always obvious. Transitions can occur gradually or suddenly, often driven by macroeconomic developments, monetary policy changes, financial crises, technological disruptions, or shifts in investor sentiment. This is where mathematics becomes essential. Quantitative models help identify subtle patterns hidden within large datasets, enabling analysts to detect regime changes earlier than traditional methods.
For organisations seeking sophisticated financial insights, Oceano Apex helps businesses and investors navigate complex market environments by leveraging data-driven approaches that combine analytical expertise with practical decision-making frameworks.
Why Mathematics Matters in Market Analysis
Financial markets generate enormous volumes of data every second. Prices fluctuate continuously, creating complex patterns that are difficult to interpret through observation alone. Mathematics provides the language needed to understand and model these dynamics systematically.
Statistical analysis allows researchers to measure volatility, correlation, and return distributions. Probability theory helps estimate the likelihood of future outcomes under different conditions. Time-series analysis examines how variables evolve over time, while stochastic models capture the inherent randomness of financial markets. Together, these mathematical disciplines create a framework for understanding how markets transition between different states.
One of the key advantages of mathematical modelling is its ability to reduce emotional decision-making. Human investors are often influenced by fear, greed, and cognitive biases. Quantitative models, by contrast, evaluate market conditions using objective criteria. While no model can predict the future with complete certainty, mathematical approaches can significantly improve the probability of making informed decisions.
In modern financial markets, institutions increasingly rely on quantitative analytics to identify opportunities, manage risk, and optimise portfolio allocation. The rise of algorithmic trading, artificial intelligence, and machine learning has further expanded the role of mathematics in financial decision-making. As technology continues to evolve, mathematical analysis remains central to understanding market regimes and adapting to changing conditions.
The Role of Probability in Market Regimes
Probability theory forms the foundation of most financial models used to analyse market regimes. At its core, probability helps quantify uncertainty. Since financial markets are inherently unpredictable, investors must evaluate outcomes based on likelihood rather than certainty.
When analysts assess market regimes, they often estimate the probability that markets belong to a specific state. For example, a model might suggest there is a 75 percent probability that current conditions reflect a low-volatility growth regime and a 25 percent probability that markets are transitioning into a higher-volatility environment. These probabilities help guide investment decisions while acknowledging uncertainty.
Bayesian probability has become particularly important in regime analysis. Unlike traditional statistical methods that rely solely on historical data, Bayesian approaches continuously update probabilities as new information becomes available. This makes them especially useful in rapidly changing market environments where conditions evolve over time.
Probability distributions also help describe market behaviour. Financial returns rarely follow perfectly normal distributions. Instead, they often exhibit skewness and fat tails, meaning extreme events occur more frequently than standard models predict. Understanding these characteristics is essential when modelling market regimes because different regimes often display distinct distribution patterns.
For investors operating in dynamic markets such as the UAE, incorporating probability-based analysis can enhance risk management and improve portfolio resilience during periods of uncertainty.
Hidden Markov Models and Regime Detection
Among the most widely used mathematical techniques for identifying market regimes is the Hidden Markov Model (HMM). This statistical framework assumes that markets operate within hidden states that cannot be observed directly but can be inferred from observable data such as asset returns and volatility.
The concept is surprisingly intuitive. Imagine driving through dense fog. You cannot see the entire landscape, but you can observe clues such as road conditions, temperature, and visibility. Similarly, investors cannot directly observe a market regime, but they can infer it through market data.
Hidden Markov Models estimate the probability that markets are currently operating within a specific regime and calculate the likelihood of transitioning to another regime. These models are particularly effective because they recognise that market states are dynamic rather than static.
For instance, a Hidden Markov Model might identify three primary regimes: a growth regime characterised by strong returns and low volatility, a transitional regime featuring increased uncertainty, and a contraction regime marked by declining prices and elevated volatility. By estimating transition probabilities, the model provides valuable insights into potential future developments.
Quantitative investment firms frequently use Hidden Markov Models to guide asset allocation decisions, risk management frameworks, and portfolio construction strategies. Their ability to adapt to evolving market conditions makes them a powerful tool for modern financial analysis.
Volatility as a Mathematical Indicator of Regime Changes
Volatility is one of the most important mathematical measures used to identify market regimes. In simple terms, volatility measures the magnitude of price fluctuations over a given period. Higher volatility generally indicates greater uncertainty, while lower volatility suggests more stable market conditions.
Mathematically, volatility is often calculated using the standard deviation of returns. By analysing changes in volatility over time, investors can gain insights into potential regime shifts. Sudden increases in volatility may signal growing uncertainty, while sustained declines often indicate improving market confidence.
Volatility clustering is another important concept. Financial markets tend to experience periods where high volatility follows high volatility and low volatility follows low volatility. This phenomenon suggests that market regimes exhibit persistence rather than random behaviour.
Advanced models such as Generalised Autoregressive Conditional Heteroskedasticity (GARCH) are commonly used to forecast volatility and detect regime changes. These models account for volatility clustering and provide a more accurate representation of market dynamics than traditional statistical methods.
Understanding volatility is particularly valuable for businesses managing investment portfolios, treasury operations, or strategic financial planning. By monitoring volatility trends, organisations can identify emerging risks and adjust their strategies accordingly.
Machine Learning and Modern Regime Classification
The growth of machine learning has transformed how analysts identify and classify market regimes. Traditional models often rely on predefined assumptions about market behaviour, whereas machine learning algorithms can uncover complex relationships directly from data.
Machine learning techniques analyse vast datasets containing price movements, economic indicators, interest rates, trading volumes, and alternative data sources. These algorithms identify patterns that may not be apparent through conventional analysis.
Unsupervised learning methods, such as clustering algorithms, are particularly useful for regime detection. These techniques group similar market conditions together without requiring predefined labels. As a result, analysts can discover previously unknown regimes and better understand how market behaviour evolves over time.
Deep learning models have further expanded analytical capabilities by processing large volumes of structured and unstructured data. News articles, earnings reports, social media sentiment, and macroeconomic indicators can all contribute to regime identification.
Despite their sophistication, machine learning models should not replace human judgement entirely. Successful implementation requires domain expertise, robust validation procedures, and ongoing monitoring. Organisations such as Oceano Apex recognise the importance of combining advanced analytics with professional expertise to deliver meaningful insights and practical business solutions.
Risk Management Through Regime Awareness
One of the most valuable applications of market regime analysis is risk management. Investors often focus on maximising returns, but long-term success depends equally on managing downside risk. Different market regimes present different risk profiles, making regime awareness essential for effective portfolio management.
During stable growth regimes, investors may allocate more capital to growth-oriented assets. During periods of heightened uncertainty, defensive positioning may become more appropriate. The ability to adapt allocations based on changing market conditions can significantly improve risk-adjusted performance.
Regime-based risk management also helps organisations prepare for rare but impactful events. Financial crises, geopolitical shocks, and unexpected economic developments often trigger abrupt regime shifts. Mathematical models cannot eliminate these risks, but they can help identify warning signs and support proactive decision-making.
Stress testing represents another important component of regime-aware risk management. By modelling how portfolios might perform under different market conditions, investors can evaluate vulnerabilities and strengthen resilience. This approach is increasingly important in today's rapidly changing global financial landscape.
Businesses across the UAE increasingly recognise the value of data-driven risk management frameworks that incorporate quantitative analysis, scenario planning, and market regime assessment.
How Market Regime Mathematics Supports Strategic Decision-Making
The practical value of market regime mathematics extends far beyond investment management. Businesses, financial institutions, and corporate decision-makers can use regime analysis to support strategic planning, capital allocation, and operational resilience.
Economic environments influence borrowing costs, investment opportunities, consumer demand, and business growth prospects. By understanding the mathematical indicators associated with different market regimes, organisations can make more informed strategic decisions. This is particularly important in internationally connected economies such as the UAE, where local markets are influenced by both regional and global developments.
Regime analysis also enhances forecasting capabilities. Rather than relying on a single forecast, organisations can evaluate multiple scenarios corresponding to different market states. This probabilistic approach provides a more realistic framework for planning under uncertainty.
As data availability continues to expand, quantitative methods will become increasingly integrated into business decision-making processes. Companies that embrace analytical approaches are better positioned to navigate uncertainty and capitalise on emerging opportunities.
Partner with Oceano Apex for Data-Driven Financial Insights
Understanding the mathematics behind market regimes requires a combination of analytical expertise, financial knowledge, and practical business experience. Whether you are an investor, business owner, or financial decision-maker, recognising how market conditions evolve can help improve risk management and support better strategic outcomes.
Oceano Apex provides professional guidance designed to help organisations navigate complex financial environments with confidence. By combining quantitative analysis with industry expertise, Oceano Apex supports clients in making informed decisions that align with their long-term objectives. To learn more about tailored solutions and professional support, contact Oceano Apex at +971 585 015 666 and discover how advanced market insights can strengthen your financial strategy.
Frequently Asked Questions
- Q1: What is a market regime?
- Ans: A market regime is a period during which financial markets exhibit consistent characteristics such as volatility levels, return patterns, liquidity conditions, and investor behaviour.
- Q2: Why are market regimes important for investors?
- Ans: Market regimes influence how investment strategies perform. Understanding the current regime helps investors adjust portfolios, manage risk, and improve decision-making.
- Q3: How does mathematics help identify market regimes?
- Ans: Mathematics uses statistical analysis, probability theory, volatility modelling, and machine learning to detect patterns and identify changing market conditions.
- Q4: What is a Hidden Markov Model?
- Ans: A Hidden Markov Model is a statistical technique used to infer hidden market states based on observable financial data such as returns and volatility.
- Q5: Can market regimes be predicted accurately?
- Ans: No model can predict market regimes with complete certainty. Mathematical models estimate probabilities and provide insights that improve decision-making under uncertainty.
- Q6: How does volatility relate to market regimes?
- Ans: Volatility measures price fluctuations and often serves as a key indicator of regime changes. Higher volatility frequently signals increased uncertainty and potential market transitions.
- Q7: How can businesses benefit from market regime analysis?
- Ans: Businesses can use regime analysis to improve strategic planning, manage financial risks, optimise capital allocation, and enhance decision-making during uncertain economic conditions.